Secure Graph Visualization Tools for KYC/AML: Enhancing Compliance and Risk Management

In the fast-paced world of finance and regulatory compliance, Know Your Customer (KYC) and Anti-Money Laundering (AML) processes are critical for maintaining the integrity of financial systems. These processes are designed to prevent criminal elements from exploiting financial institutions to launder money or finance terrorism. As global regulations become increasingly stringent, the need for robust and secure graph visualization tools has never been more pressing.
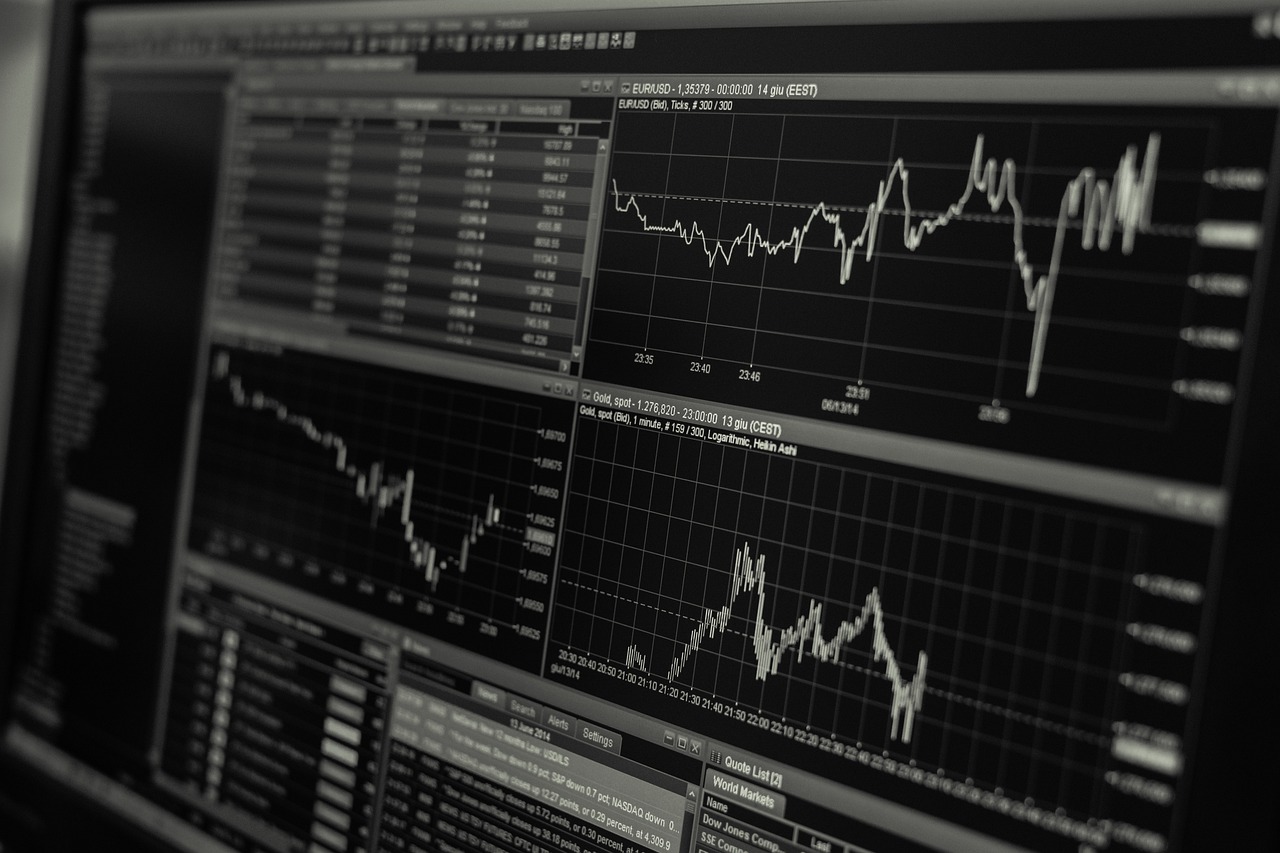
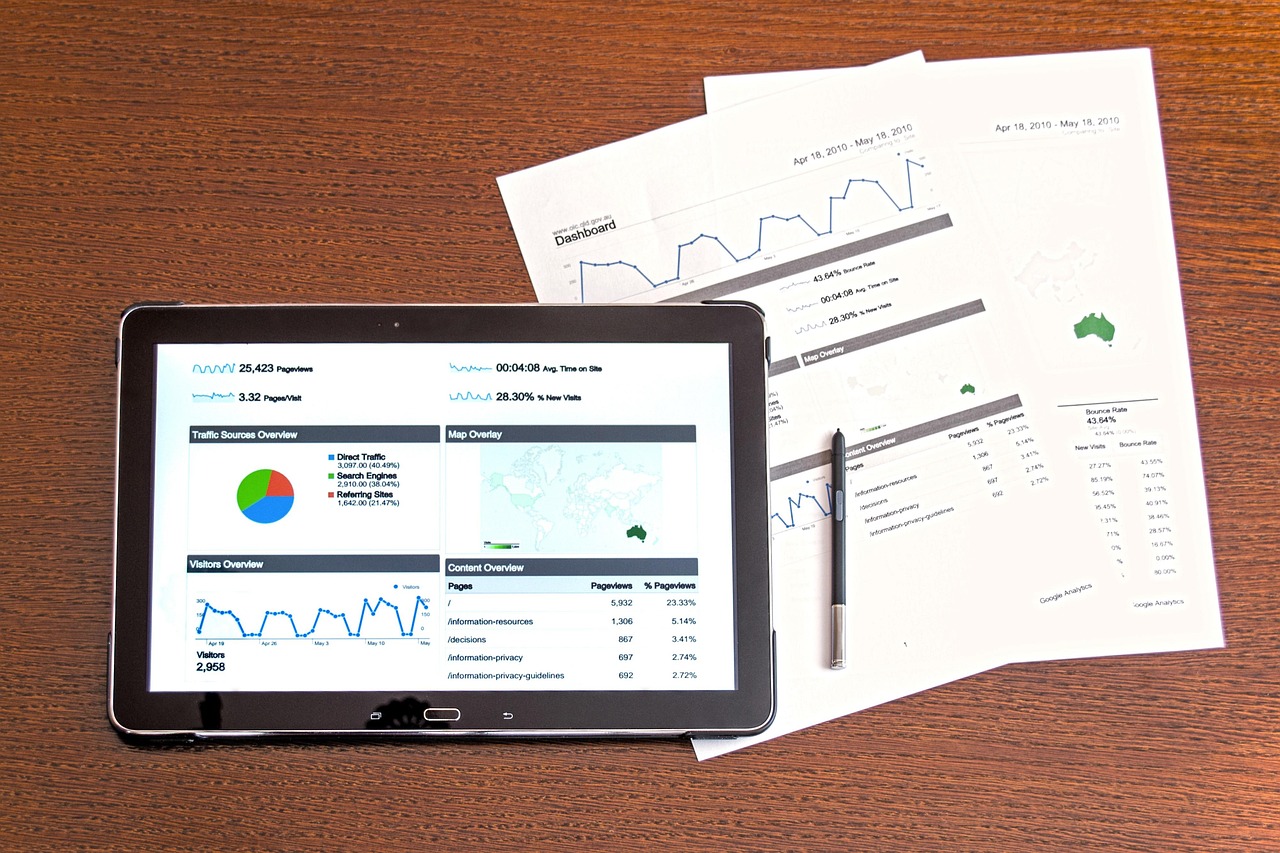
Graph visualization tools play a pivotal role in KYC/AML by transforming complex datasets into visual formats that are easier to interpret. This helps compliance officers and analysts to identify suspicious patterns, connections, and transactions that might otherwise go unnoticed. The global context of financial regulations, combined with the technological advancements in data processing, emphasizes the importance of these tools in ensuring compliance and mitigating risks.
The Importance of Security in Graph Visualization
Security in graph visualization is paramount, especially when dealing with sensitive financial data. Financial institutions must ensure that their visualization tools are compliant with global data protection standards such as the General Data Protection Regulation (GDPR) in Europe and the California Consumer Privacy Act (CCPA) in the United States. These regulations mandate stringent data protection measures to safeguard personal information from unauthorized access and breaches.
Secure graph visualization tools incorporate encryption, access controls, and audit trails to protect sensitive data. Encryption ensures that data is unreadable to unauthorized users, while access controls restrict data access to authorized personnel only. Audit trails provide a record of who accessed the data and what changes were made, ensuring accountability and transparency.
Key Features of Effective Graph Visualization Tools
- Interactivity: These tools offer interactive features that enable users to explore data dynamically. Users can zoom in on specific nodes, filter data based on criteria, and drill down into detailed information, enhancing their ability to analyze complex relationships.
- Scalability: As financial institutions handle ever-growing volumes of data, scalability is crucial. Effective tools must accommodate large datasets without compromising performance or speed.
- Integration: Seamless integration with existing systems and databases is essential. This allows for real-time data updates, ensuring that the visualizations reflect the most current information.
- Customizability: Different organizations have unique needs and regulatory requirements. Customizable visualization options enable institutions to tailor the tool to their specific KYC/AML processes.
- Advanced Analytics: Incorporating machine learning and artificial intelligence can enhance the ability to detect anomalies and predict risky behavior, providing deeper insights into potential threats.
Global Context and Challenges
The global financial landscape is characterized by diverse regulatory environments. Institutions operating internationally must navigate a complex web of local and international regulations. Graph visualization tools must be adaptable to these varying legal frameworks, ensuring compliance across jurisdictions.
Additionally, the rise of digital currencies and fintech innovations presents new challenges for KYC/AML. While these technologies offer increased efficiency, they also introduce new risks, such as the potential for anonymous transactions and rapid cross-border money transfers. Secure graph visualization tools are critical in addressing these challenges by providing visibility into digital financial ecosystems.
Conclusion
As financial institutions face mounting pressure to comply with stringent KYC/AML regulations, secure graph visualization tools have become indispensable. By transforming complex data into comprehensible visual formats, these tools enable organizations to identify and mitigate risks effectively. To remain compliant and competitive, institutions must invest in secure, scalable, and customizable visualization solutions that integrate seamlessly with their existing infrastructure.
In a world where financial crimes are becoming increasingly sophisticated, staying ahead requires not only understanding the current landscape but also anticipating future threats. Secure graph visualization tools are a vital component in this ongoing effort, empowering institutions to protect their assets and uphold the integrity of the global financial system.


